The UK Childcare Affordability Report 2026
Where in the UK is childcare most affordable?
As the cost of living crisis continues, how do childcare costs compare to average disposable income levels around the UK? Moorepay analysed government data to find out.

Contents
-
Chapter 1
Introduction
-
Chapter 2
The UK cities where childcare is cheapest compared to disposable income
-
Chapter 3
Analysing childcare affordability in the UK regions
-
Chapter 4
The local authorities where childcare is most and least affordable
-
Chapter 5
The difference in childcare affordability between London boroughs
-
Chapter 6
Compare the data on childcare affordability around the UK

Chapter 1
Introduction
In this chapter you’ll learn
- The dilemma facing working parents of young children.
- How the quality of early years care provision has long-term ramifications.
- How we analysed government figures to compare childcare affordability around the UK.
For many families, early parenthood is a moment for consolidation: taking fresh stock of household income and expenditure and figuring out how to secure long-term financial security and wellbeing. And for many parents, this begins with weighing up the benefits or necessities of going back to work versus remaining at home with the children.
Around 77.2% of mothers with dependent children in Scotland and Wales work, and around 74.8% in England, although research suggests that 27% of mothers either don’t return to work or leave within 12 months of returning from childbirth if they do. Historically, this effect has been particularly felt in London, although more recent figures are not available.
However, this dilemma of whether to return to work has become acute in the 2020s, with a Local Government Association report noting that “[c]hallenges caused by the systematic underfunding of early years provision are being exacerbated by the rising cost of living and inflationary pressures.” The report also notes that children who haven’t had access to quality childcare at the pre-school stage may find themselves more than 18 months “behind their peers” by the time they sit their GCSE exams at age 16.
But the economic challenge facing parents differs depending on local salary levels and childcare costs. To find which UK regions, cities and authorities are most and least affordable for childcare, Moorepay calculated the average hourly childcare cost in each location as a percentage of the local average hourly disposable income for two parents, using data from government sources. (Please note, Northern Ireland was excluded from our study due to a lack of available data.)
Key findings
-
20.2The cost of hourly childcare as a percentage of a couple’s hourly disposable income in London, making it the most affordable UK region.
-
37.7The cost of childcare compared to the average disposable income in Nottingham – the least affordable city for childcare in our study.
-
20.9The average cost of childcare as a percentage of disposable income in Edinburgh, the city where we found childcare to be most affordable.

Chapter 2
The UK cities where childcare is cheapest compared to disposable income
In this chapter you’ll learn
- How we calculated the affordability of childcare in the UK’s biggest cities.
- The cities with the most and least affordable childcare.
- The region where low-affordability childcare is most prevalent.
First, we calculated the average cost of childcare in 49 of the UK’s biggest cities using pricing data from the Department for Education’s “Childcare and Early Years Provider Survey” (England), Gov.Scot’s Early Learning and Childcare report (Scotland), and Coram’s Childcare Survey (Wales).
We then sourced the average hourly disposable income for each city from the Office for National Statistics (ONS).
We found that in Edinburgh, average hourly childcare is £6.73, which is 20.9% of the average hourly disposable income for two people (£32.18). This 20.9% affordability score makes Edinburgh the most affordable major city for childcare in the UK.
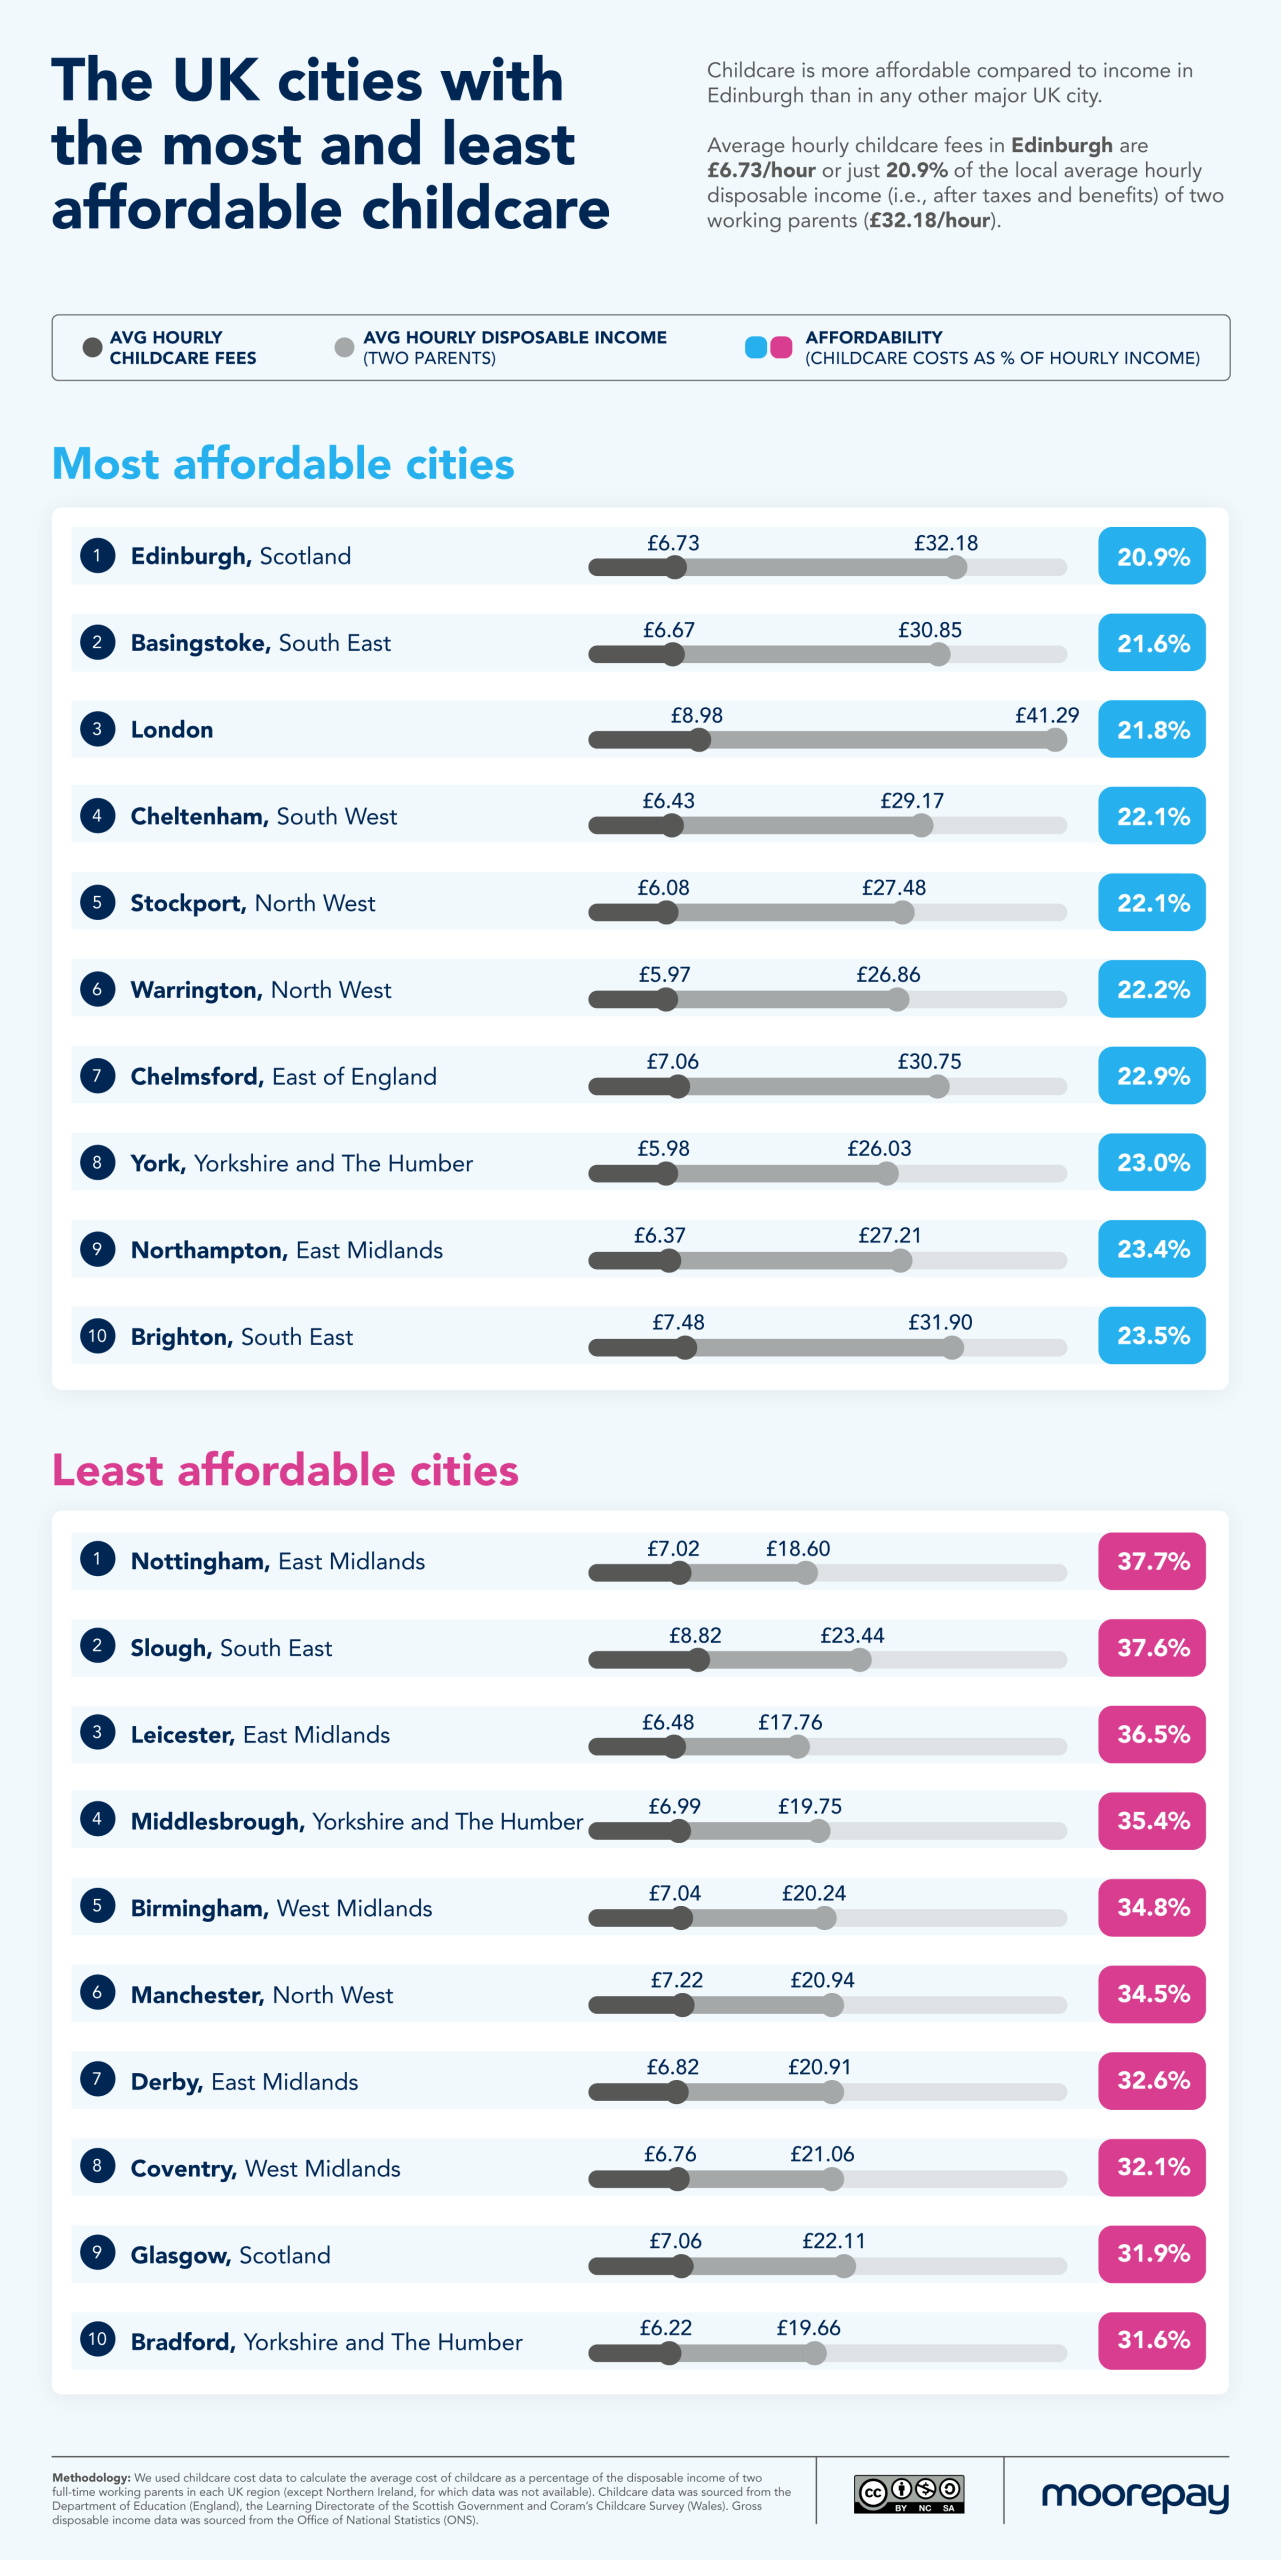
At the other extreme, we found that childcare costs account for a larger proportion of disposable income in Nottingham (37.7%) and Slough (37.6%) than in any other major UK city. That’s around 1.8 times as much as in Edinburgh.
While there is a good geographic spread between the ten most affordable cities, five of the ten least affordable cities are in the Midlands, and two are in Yorkshire and The Humber.

Chapter 3
Analysing childcare affordability in the UK regions
In this chapter you’ll learn
- The regions where childcare affordability is most and least affordable.
- How London childcare costs and wages compare to other regions.
- How childcare costs in Scotland and Wales measure up against other UK regions.
Next, we ranked the mainland UK regions by childcare affordability compared to average local disposable income.
We found that although London has the highest average childcare cost (£8.98 per hour), the average amount of disposable income per couple per hour in the capital (£44.38) is high enough to make it the most affordable region for childcare. An hour of childcare in London costs just 20.2% of the disposable income left over from two average adults’ hourly wages.
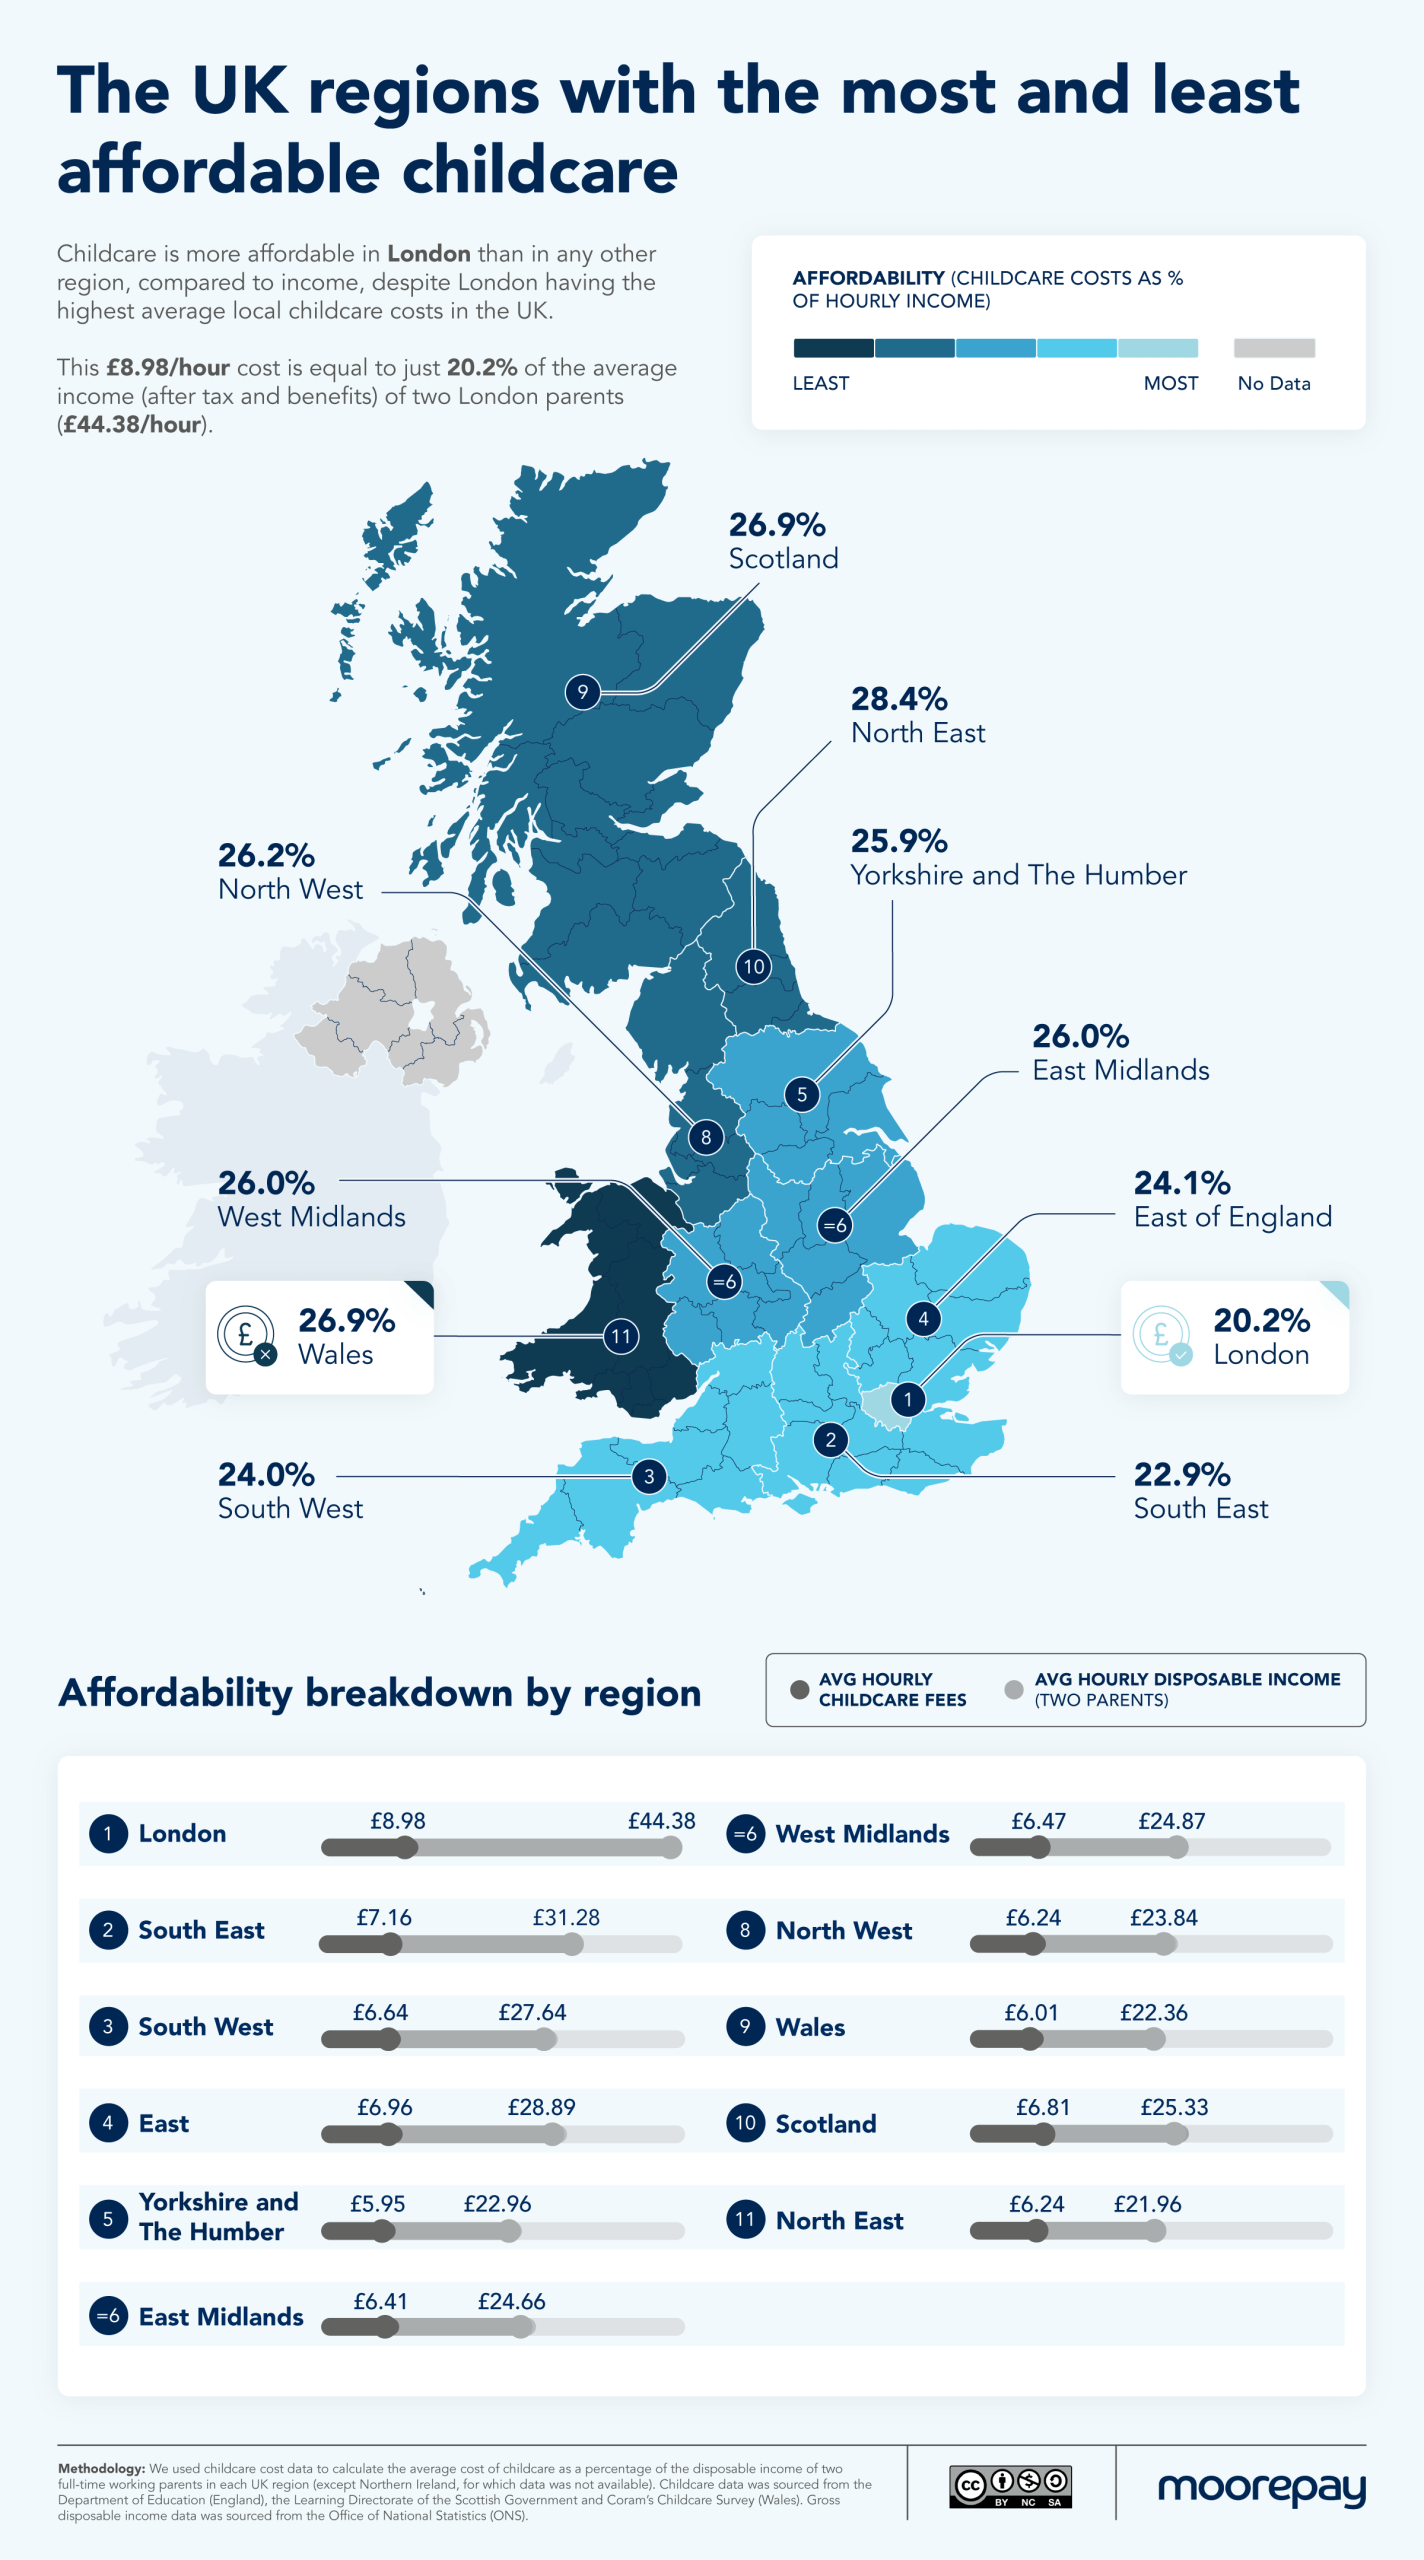
Wales and Scotland are the ninth and 10th most affordable (or the second and third least affordable) regions, with childcare costing around 26.9% of disposable income in both regions – which are separated by just a few decimal points.
The least affordable region is the North East (28.4%). This can largely be attributed to the North East having the lowest levels of disposable income of the regions covered in our study, as it enjoys among the lowest average childcare costs in the UK.

Chapter 4
The local authorities where childcare is most and least affordable
In this chapter you’ll learn
- The local authorities where childcare is most and least affordable.
- How high disposable income levels more than balance out high childcare costs in some areas.
- The local authorities where childcare costs over one-third of disposable income.
Local authorities in the East and South East of England dominate among those with the most affordable childcare compared to disposable income.
The South East authorities of Elmbridge and Sevenoaks are first and third most affordable respectively. This is despite Elmbridge having the 35th-highest childcare fees in the UK among the 347 local authorities in our study. These costs are offset by Elmbridge having the sixth-highest level of disposable income, at £26.84 per hour or £53.68 for a couple. At these rates, hourly childcare costs just 14.7% of the average couple’s hourly disposable income.
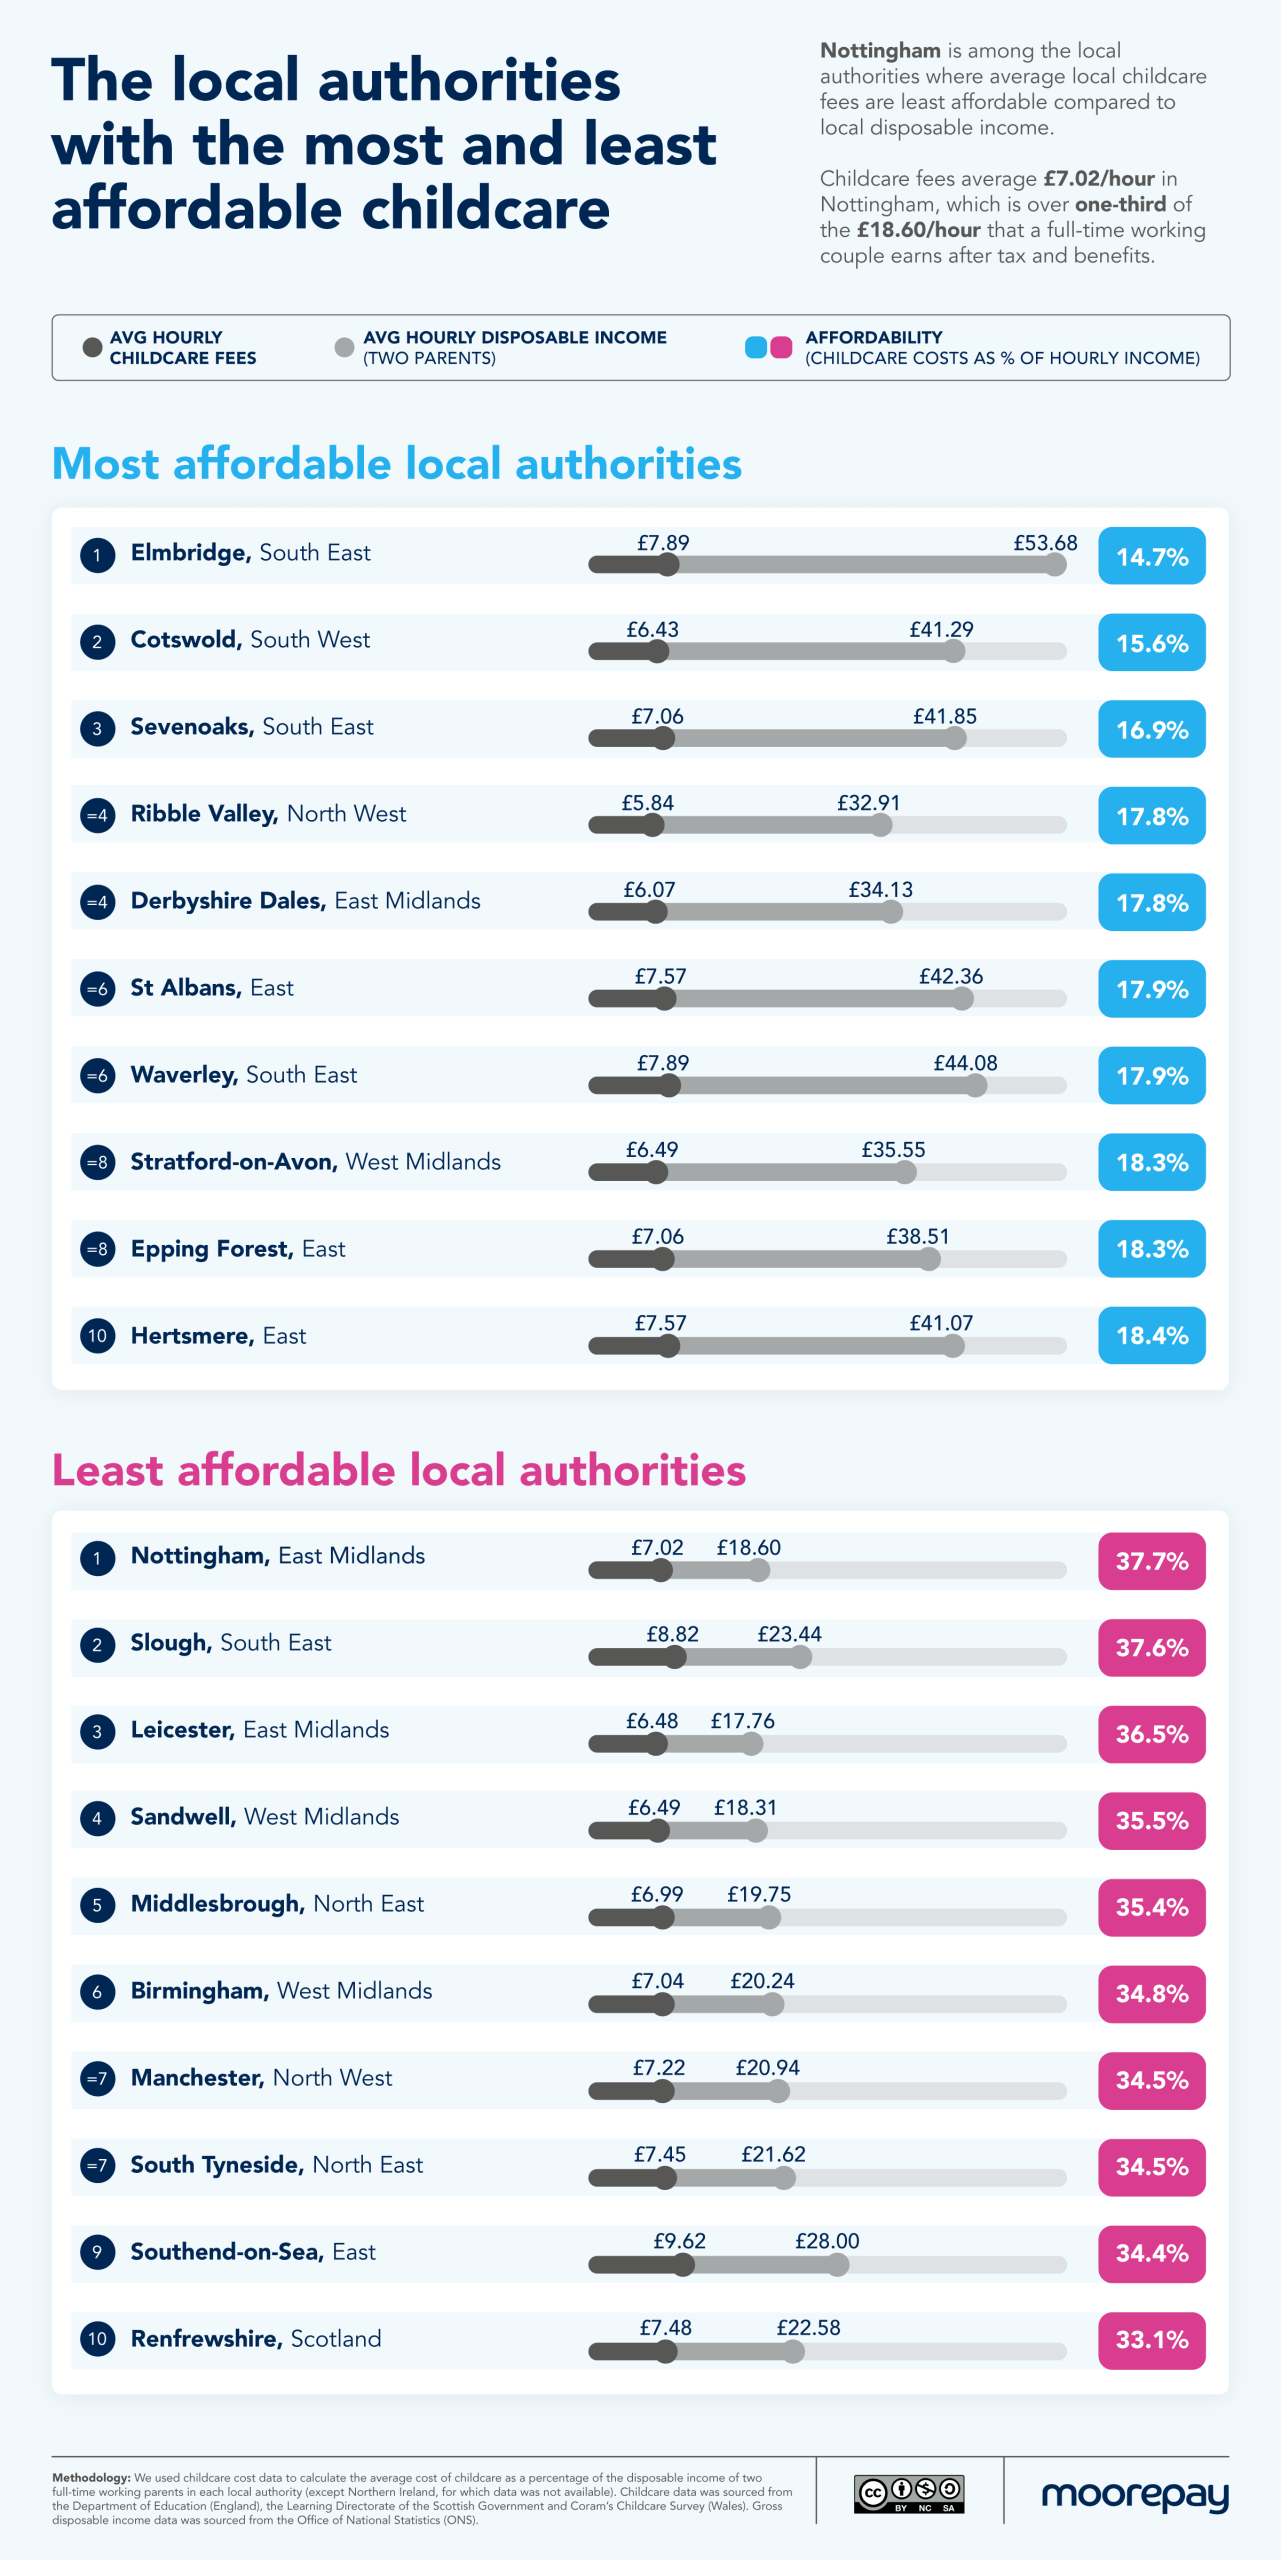
Slough is the only South East authority among the ten least affordable local authorities. It ranks second among nine authorities in which childcare costs more than one-third of disposable income. Slough has the 16th-highest average childcare costs while being in the bottom 34% of local authorities for disposable income.

Chapter 5
The difference in childcare affordability between London boroughs
In this chapter you’ll learn
- How vastly childcare prices and affordability vary across the London boroughs.
- How the borough with the most disposable income eclipses income levels elsewhere in the capital.
- The London boroughs where childcare affordability is best and worst.
In London, childcare affordability is largely dictated by wage disparity. Even leaving out Kensington and Chelsea – where disposable income is 45% higher than any other London borough – there is a 261% difference between disposable income levels in the boroughs with the second best (Westminster) and overall worst (Barking and Dagenham) affordability. The difference in childcare costs is relatively low, but still significant, at 44%.
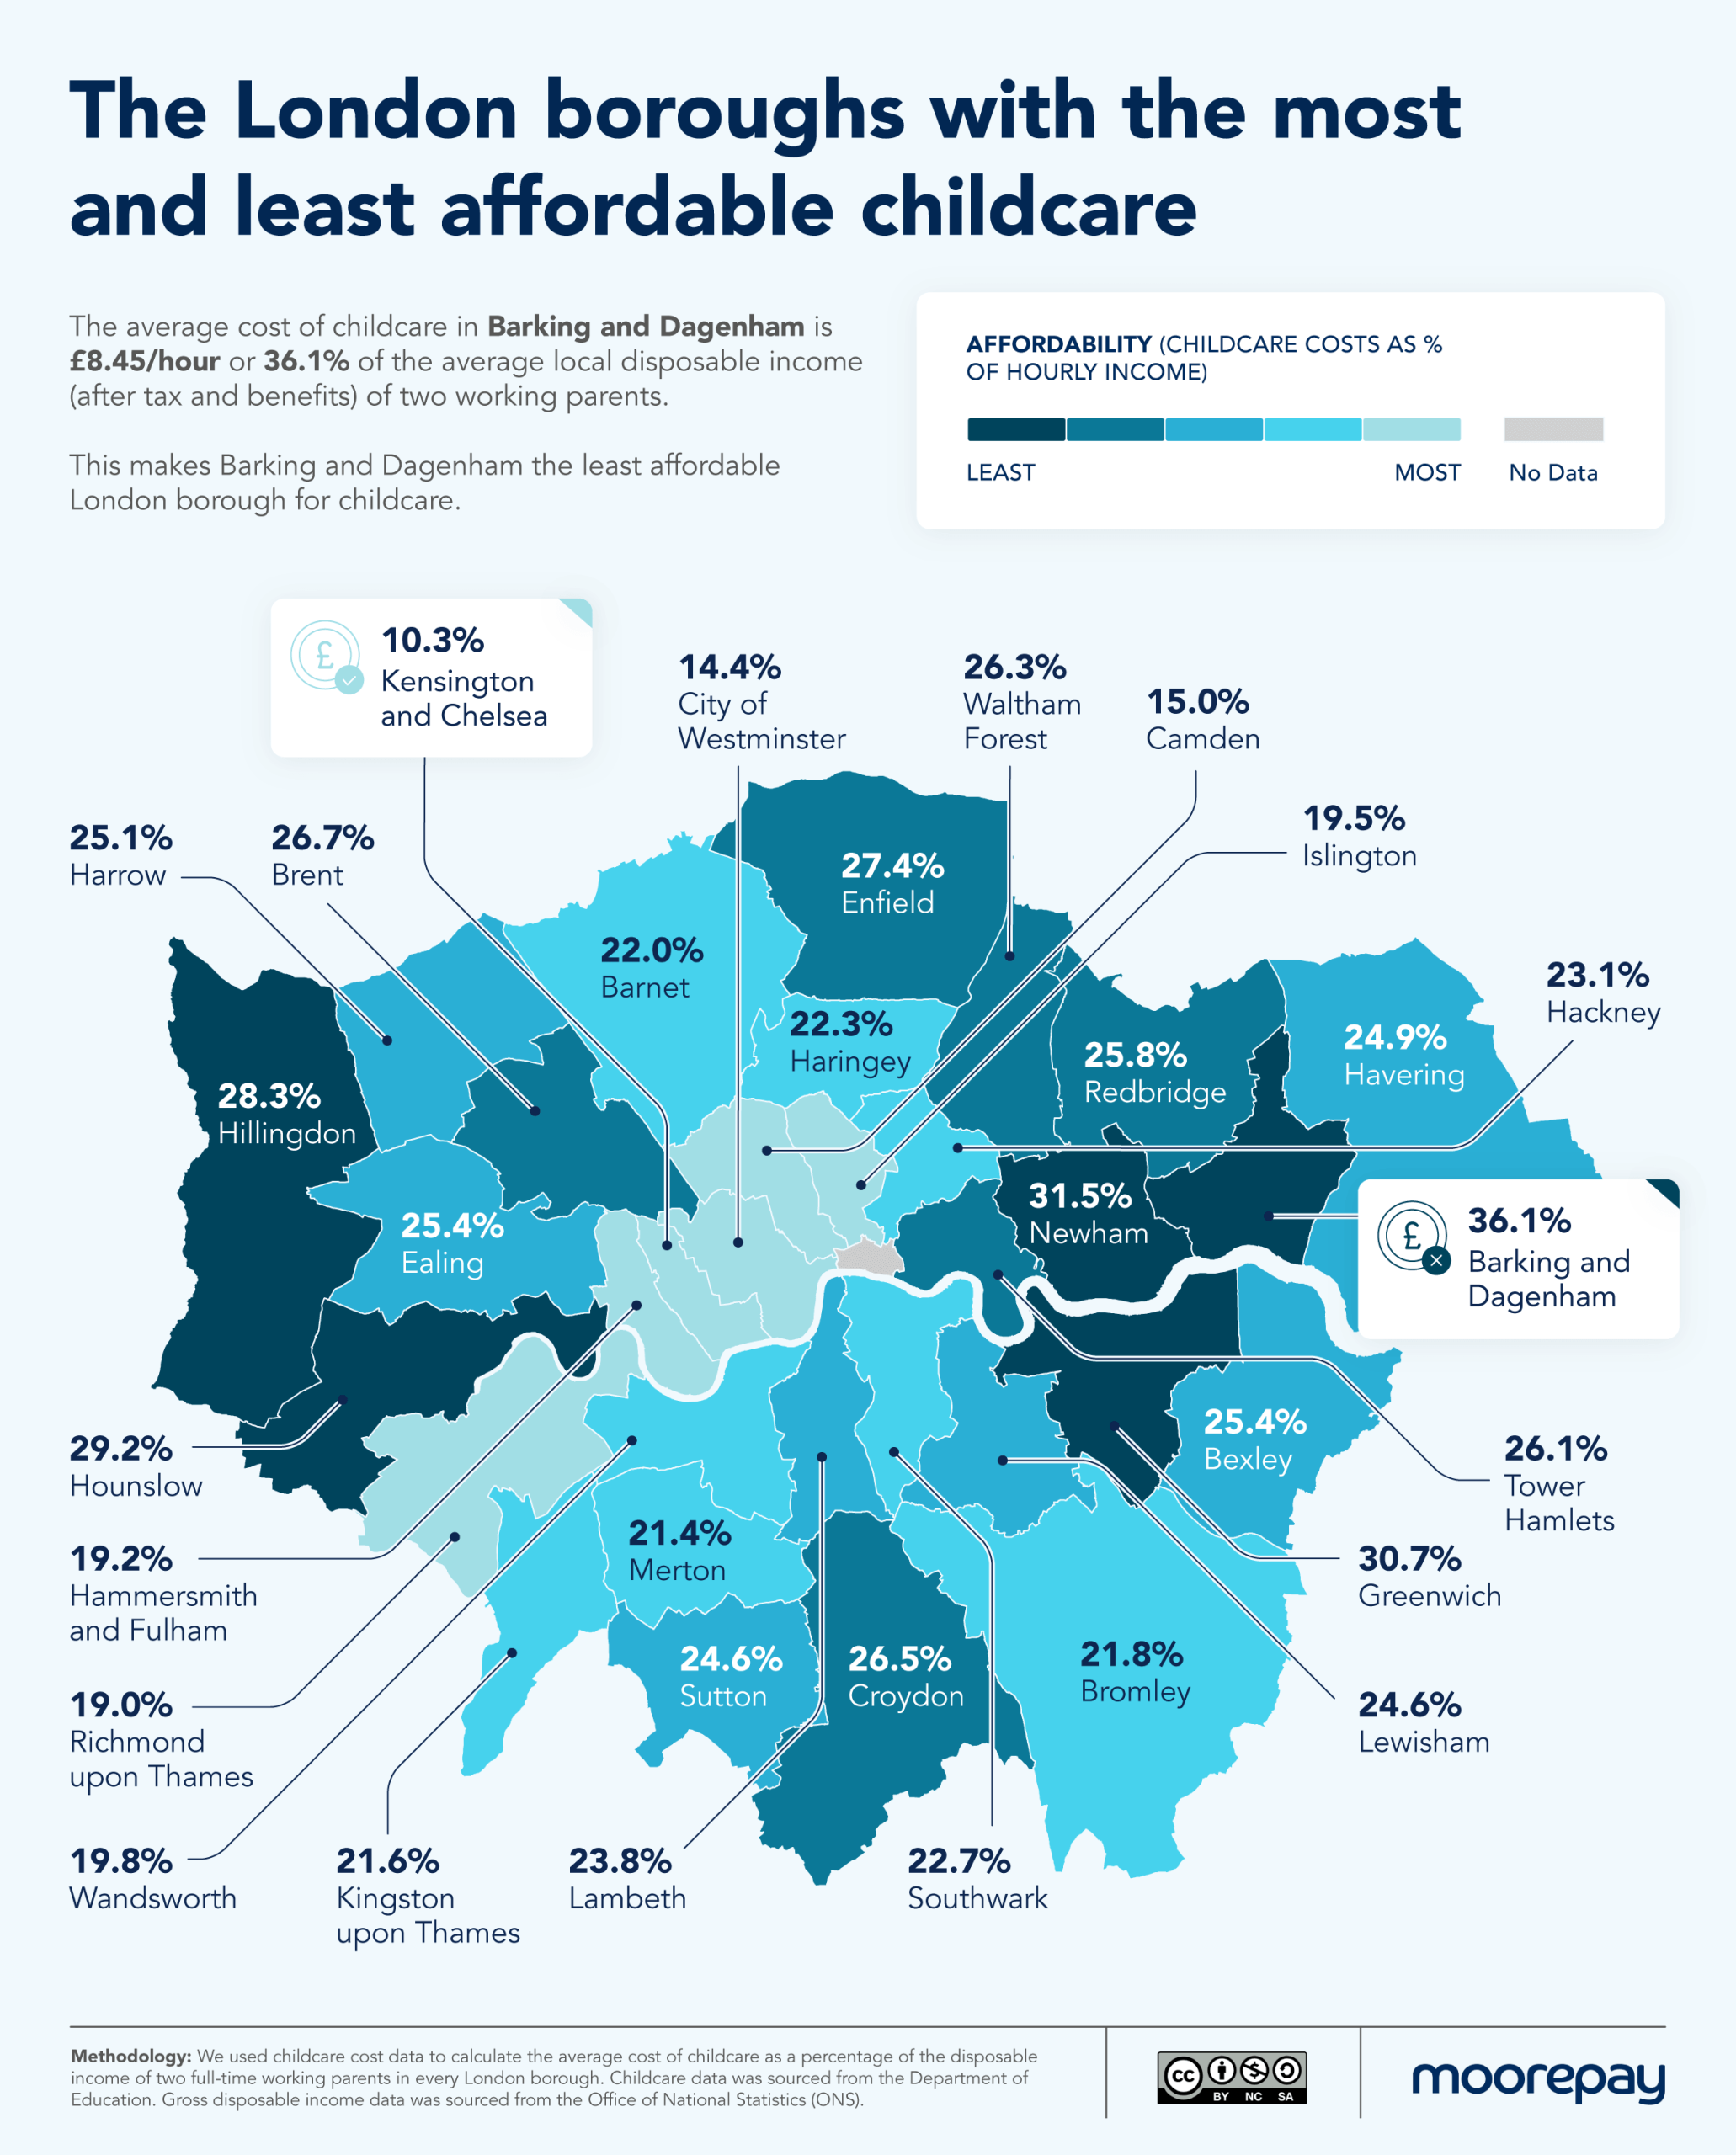
But that still leaves Kensington and Chelsea as far and away the most affordable. Average childcare costs in Kensington and Chelsea are £12.56, or just 10.3% of the average working couple’s hourly disposable income (£122.31).

Chapter 6
Compare the data on childcare affordability around the UK
In this chapter you’ll learn
- The comparison of childcare affordability against disposable income levels across the country.
Finally, we compiled our data on childcare affordability across major UK cities and local authorities in the interactive table below. You can use the search and sort functions to compare childcare affordability as calculated by balancing local childcare costs against average disposable income levels across the country.
Read more about your rights and the economics of working families
-

Your guide to paternity leave and pay
When your employee tells you their family is expecting a baby, there’s a lot to do. We’ve compiled everything you need to know in one in-depth resource.
-

Your guide to maternity leave and pay
The postnatal period is a critical moment for new mothers and their children. We found out what each country offers and what the real value of maternity pay means, considering local purchasing power.
Methodology & Sources
We measured the affordability of childcare in each location by calculating the average hourly childcare prices as a percentage of the average hourly disposable income of two parents.
The average gross disposable income (per head) by location was sourced from the Office for National Statistics (ONS). Gross disposable household income is defined as “the exact amount of money individuals have left to spend or save after they have paid direct and indirect taxes (like income tax and council tax) and received any direct state benefits (like pensions or universal credit)”. To more accurately reflect the disposable income of a typical family with two employed parents, we multiplied the ONS’ “per head” figures by two.
Average hourly childcare prices were sourced and calculated from data in the Department for Education’s “Childcare and Early Years Provider Survey” (England), Gov.Scot’s Early Learning and Childcare report (Scotland), and Coram’s Childcare Survey (Wales).
Childcare pricing for Wales was calculated at the national level due to the lack of existing regional or local data. Northern Ireland lacked any comparable childcare data, so it was excluded from this report.
The data is correct as of July 2026.
Contents
-
Chapter 1
Introduction
-
Chapter 2
The UK cities where childcare is cheapest compared to disposable income
-
Chapter 3
Analysing childcare affordability in the UK regions
-
Chapter 4
The local authorities where childcare is most and least affordable
-
Chapter 5
The difference in childcare affordability between London boroughs
-
Chapter 6
Compare the data on childcare affordability around the UK